 https://www.synyo.com/wp-content/uploads/SYNYO-NEWS-featured-image-NEW01007705EN.png
400
459
leo
https://www.synyo.com/wp-content/uploads/2017/09/synyo-logo.png
leo2025-01-01 10:47:112025-02-10 10:48:51BOND: Outcomes in Advancing Education, Tolerance and Heritage Preservation to combat Antisemitism
https://www.synyo.com/wp-content/uploads/SYNYO-NEWS-featured-image-NEW01007705EN.png
400
459
leo
https://www.synyo.com/wp-content/uploads/2017/09/synyo-logo.png
leo2025-01-01 10:47:112025-02-10 10:48:51BOND: Outcomes in Advancing Education, Tolerance and Heritage Preservation to combat AntisemitismsEEnergies

sEEnergies: Mapping energy potentials in transport and excess heat potentials in European industry systems
PETA5 is an interactive map developed within sEEenergies, where data is continuously updated to show energy potentials from the housing, transport and industrial fields in 14 European countries. Previous research data can be found on PETA4 map, developed during the Heat Roadmap Europe project.
Transport is highly context-specific, and so are the potential efficiency gains in this sector. Context can be established through mapping of the factors that drive mobility on the level of individual settlements. These are, among others, the sizes of human settlements, their population and density, and their location. While the location of residential areas relative to the urban centres can be used to describe the intra-urban transport, regional mobility is affected by the distance between settlements, in a hierarchy of smaller to larger and metropolitan areas.
A geographical data base has been developed at Europa-Universität Flensburg, which facilitates the mapping of efficiency potentials in the transport sector, while it provides the quantitative basis for analysing the impact of urban structures on transport volumes and the potential for modal shifts across Europe. About 150,000 so called Urban Areas have been mapped along with variables that may affect transport choice. Based on land cover mapping, urban areas have been delineated in a novel way, and their similarity in terms of demography, topography, and transport distances. Furthermore, the past development since 1990 can be traced in regard to population, density and distance.
Facilities of energy-intensive industries including those for the production of steel, cement, paper, glass, chemicals and others are spread across Europe. The combination of high flue gas temperatures, continuous operation and highly concentrated point sources make the excess heat from such industrial plants a very attractive source for district heating. Despite this, excess heat sources from industry are currently only rarely exploited and major potentials are being wasted.

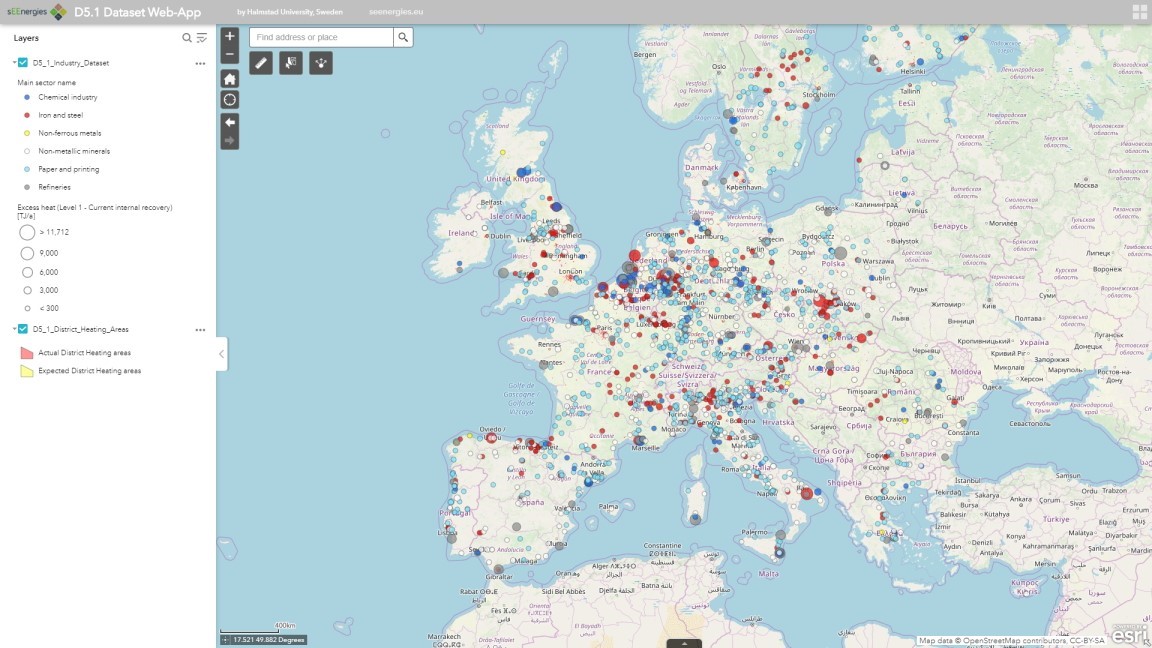
sEEnergies aims to contribute by providing the most detailed, comprehensive assessment of the excess heat potentials available for Europe. More specifically, we aim to analyse the available excess heat from heavy industry in Europe and assess its suitability for use in district heating systems. Our approach uses GIS-based mapping of 1608 industrial sites in Europe combined with a process-specific assessment of their excess heat potential. The heat sources are then matched with data on heat demand density and existing as well as potential district heating networks. The scope of this analysis covers the major industrial excess heat sources (large heavy industry facilities) and the most important excess heat streams: flue gases.
Our results show a total potential of 425 PJ of excess heat available at a temperature of 95°C, with 960 PJ available at a lower temperature (25°C). This equals about 4% and 9% of total industrial final energy demand in 2015, respectively.
Matching this potential with a GIS analysis of heat demand densities and current district heating systems reveals that 151 PJ of excess heat could be used within a 10km range at a temperature of 95°C, which is compatible with most existing district heating systems. As district heat today has a total final energy consumption of 1,945 PJ, this means that about 8% of district heating in the EU28 could be supplied by excess heat sources from energy-intensive industries.
It should be emphasized that the used bottom-up approach inherently underestimates the available potentials, because it focuses on the largest point sources, major processes and flue gases as the most attractive excess heat streams. Although the analysis covers the most attractive potentials, including additional excess heat sources would increase the potentials available, particularly at lower temperatures. However, it should also be considered that some of the excess heat might be used via internal heat recovery before it is delivered to a district heating system.
Datasets were shared within the sEEnergies project and through a publicly accessible open data hub. The developed online map supports the understanding of the quantitative and geographical data provided here. The open data hub will provide public access to geographical data of the sEEnergies project. The two major outputs from this work, the georeferenced industrial sites dataset and the district heating areas dataset (expected and actual), are published as web map layers at the sEEnergies D5.1 Web-App hosted by Europa-Universität Flensburg:
The datasets are further available for download at the sEEnergies Open Data Hub
The data is visible on a map but also available for download in geospatial and tabular form. The datasets are published under the Creative Commons CC BY 4.0 license.
Links
https://euf.maps.arcgis.com/apps/webappviewer/index.html?id=43888b15ffd7409d8e544ad83b3a59a6
https://s-eenergies-open-data-euf.hub.arcgis.com/
Keywords
Co-creation, user requirements, inclusive process


